The damage of cars
Automobiles pose a significant challenge in the global effort to combat climate change. Transportation contributes to roughly a fifth of total carbon emissions worldwide, and among contemporary transportation options, petrol-burning cars are notably inefficient. Beyond air pollution, cars require substantial space for operation and inflict various negative externalities on cities.
In this post, I revisit São Paulo to assess the extent of the city’s dependence on cars. The data used is available via my R package tidypod.
São Paulo
São Paulo is a megacity with over 12 million inhabitants. The city recently declared its commitment to a significant reduction in greenhouse gas emissions, aiming for net-zero emissions by 2050. Achieving this goal requires a strategic focus on improving public transit options and diminishing reliance on cars. In the Greater São Paulo area, cars currently represent nearly 27% of all trips.
Similar to much of the southeastern region of Brazil, São Paulo boasts a predominantly clean energy matrix. The city’s primary challenge lies in the realm of transportation. Specifically, there is a need to reduce the size of the car fleet and enhance public transportation alternatives.
One effective measure of car-dependency is assessing the prevalence of car-free households. Using the most recent Origin Destination Survey data I estimate the share of households without cars. The data is aggregated by OD zone: after cleaning, there are 329 valid OD zones in São Paulo1. To quickly get this data I use the tidypod package.
The data suggest that constraints related to income, rather than preferences, predominantly keep car usage low. Interestingly, some of the OD zones with the lowest share of car-free households are affluent neighborhoods spatially close to key business districts in the city.
It’s important to note that reducing car-dependency doesn’t necessarily mean removing cars from the streets. As professor Dorel Soares Ramos, from the University of São Paulo, explains “renewable gaseous fuels” such as “biomethane” are considered “green for fleet adaptation”2. Similarly, electric automobiles will contribute to lowering carbon emissions. However, irrespective of the energy source for cars, we must still address the numerous negative externalities associated with their use.
Share of car-free households
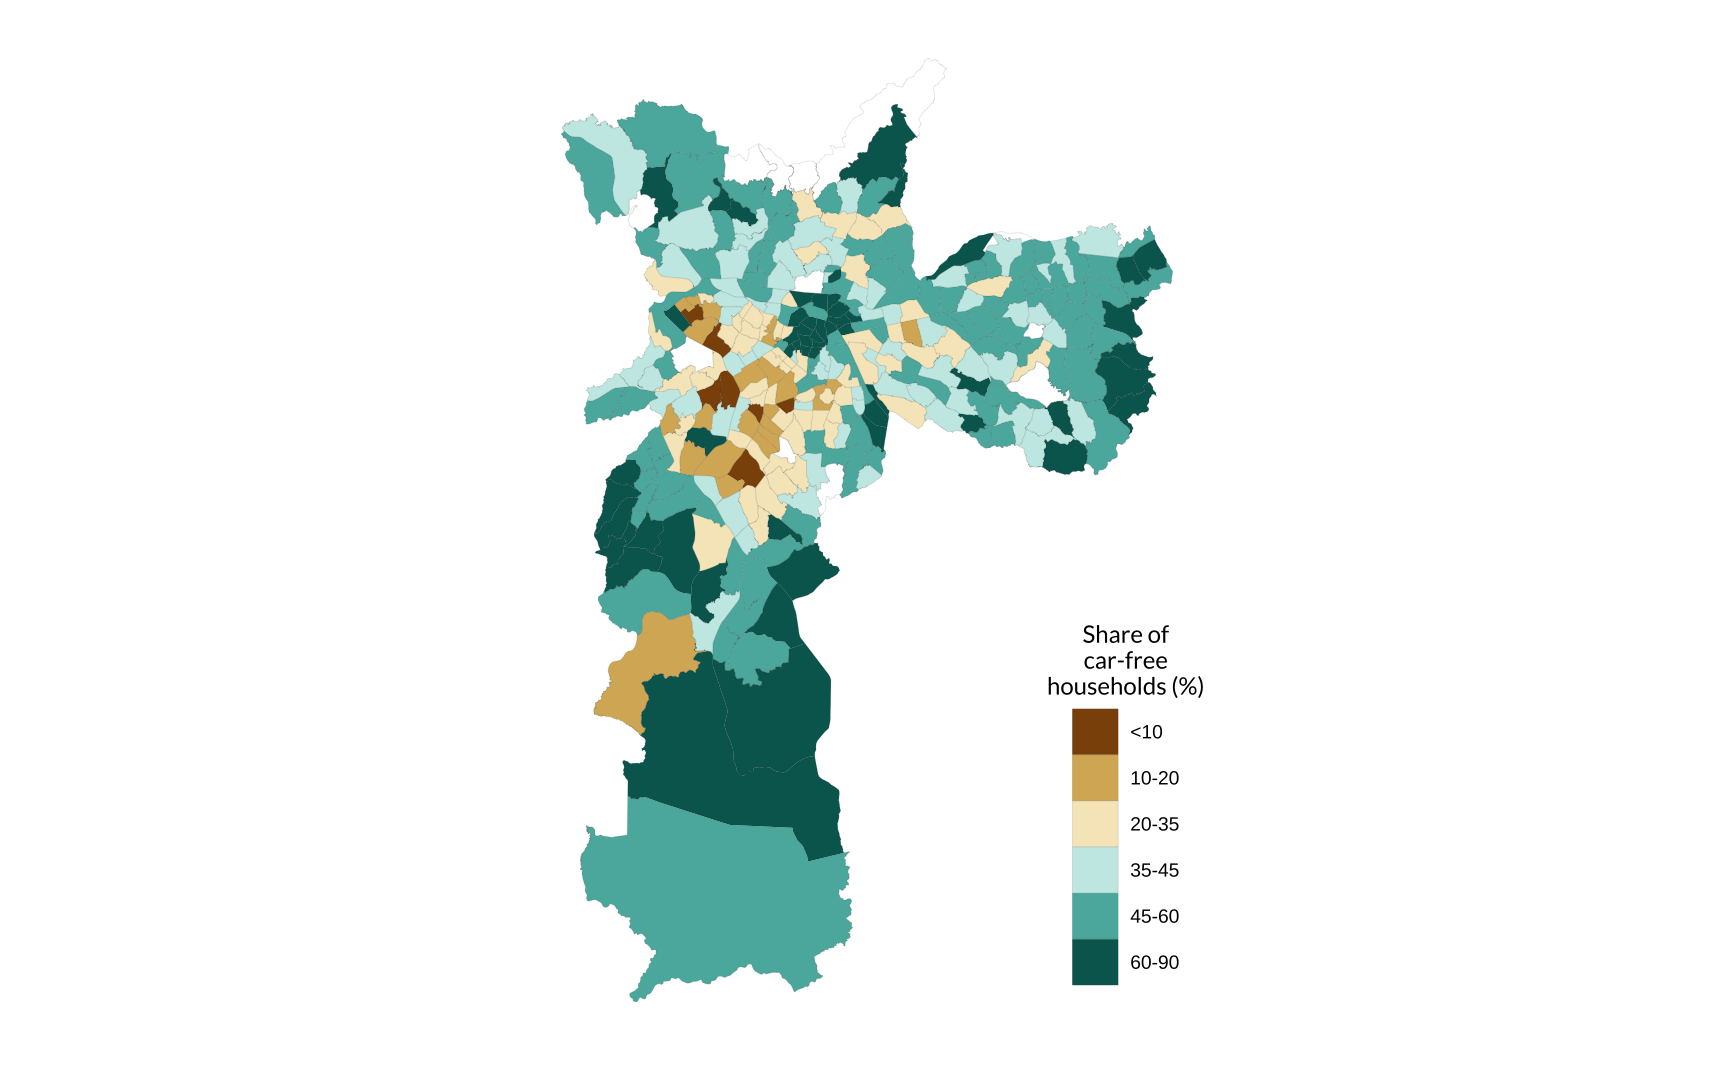
Car-free households seem to be spatially concentrated at peripheral regions of the city, very far away from any of the cities CBDs. The notable exception is the green mass right at the “old” CBD (Centro Histórico). While this region has very high share of car-free households, it should be noted that is also is not a very populated region. The “newer” CBDs of Paulista and Itaim have much lower shares of car-free households.
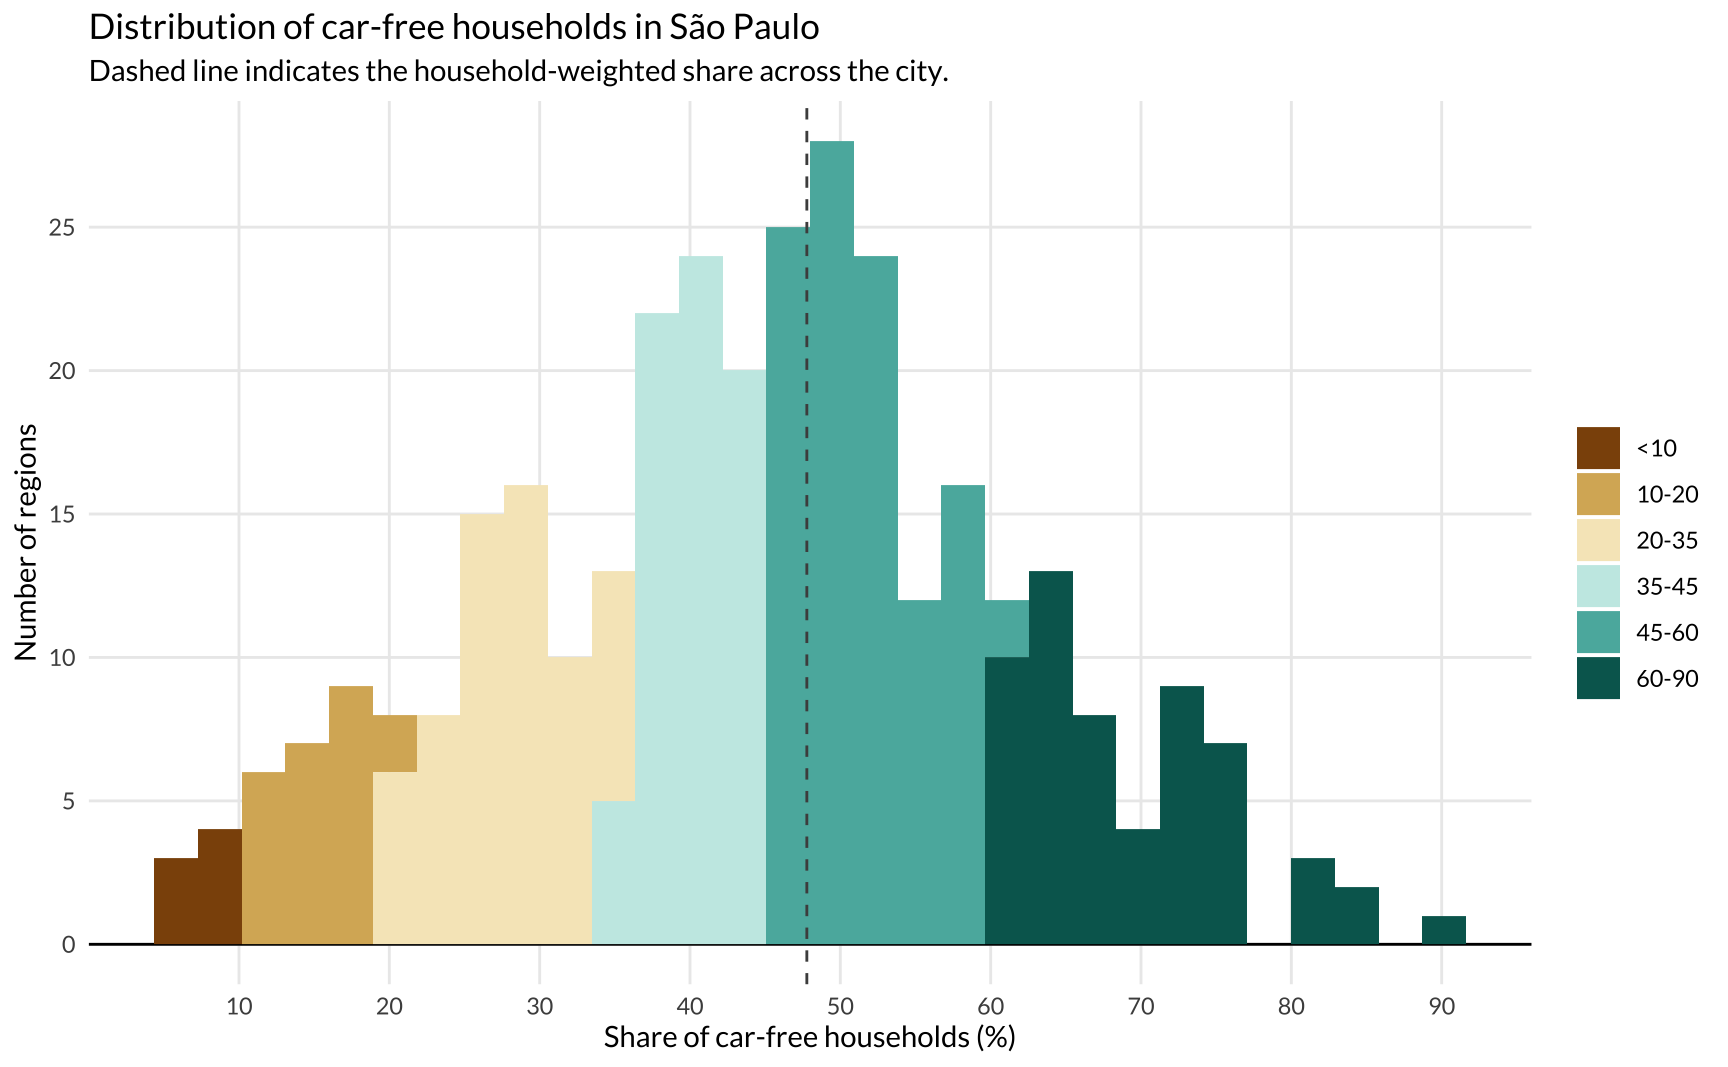
Close to half of São Paulo’s households are entirely car-free, and in certain regions, virtually every household opts to go without any cars.
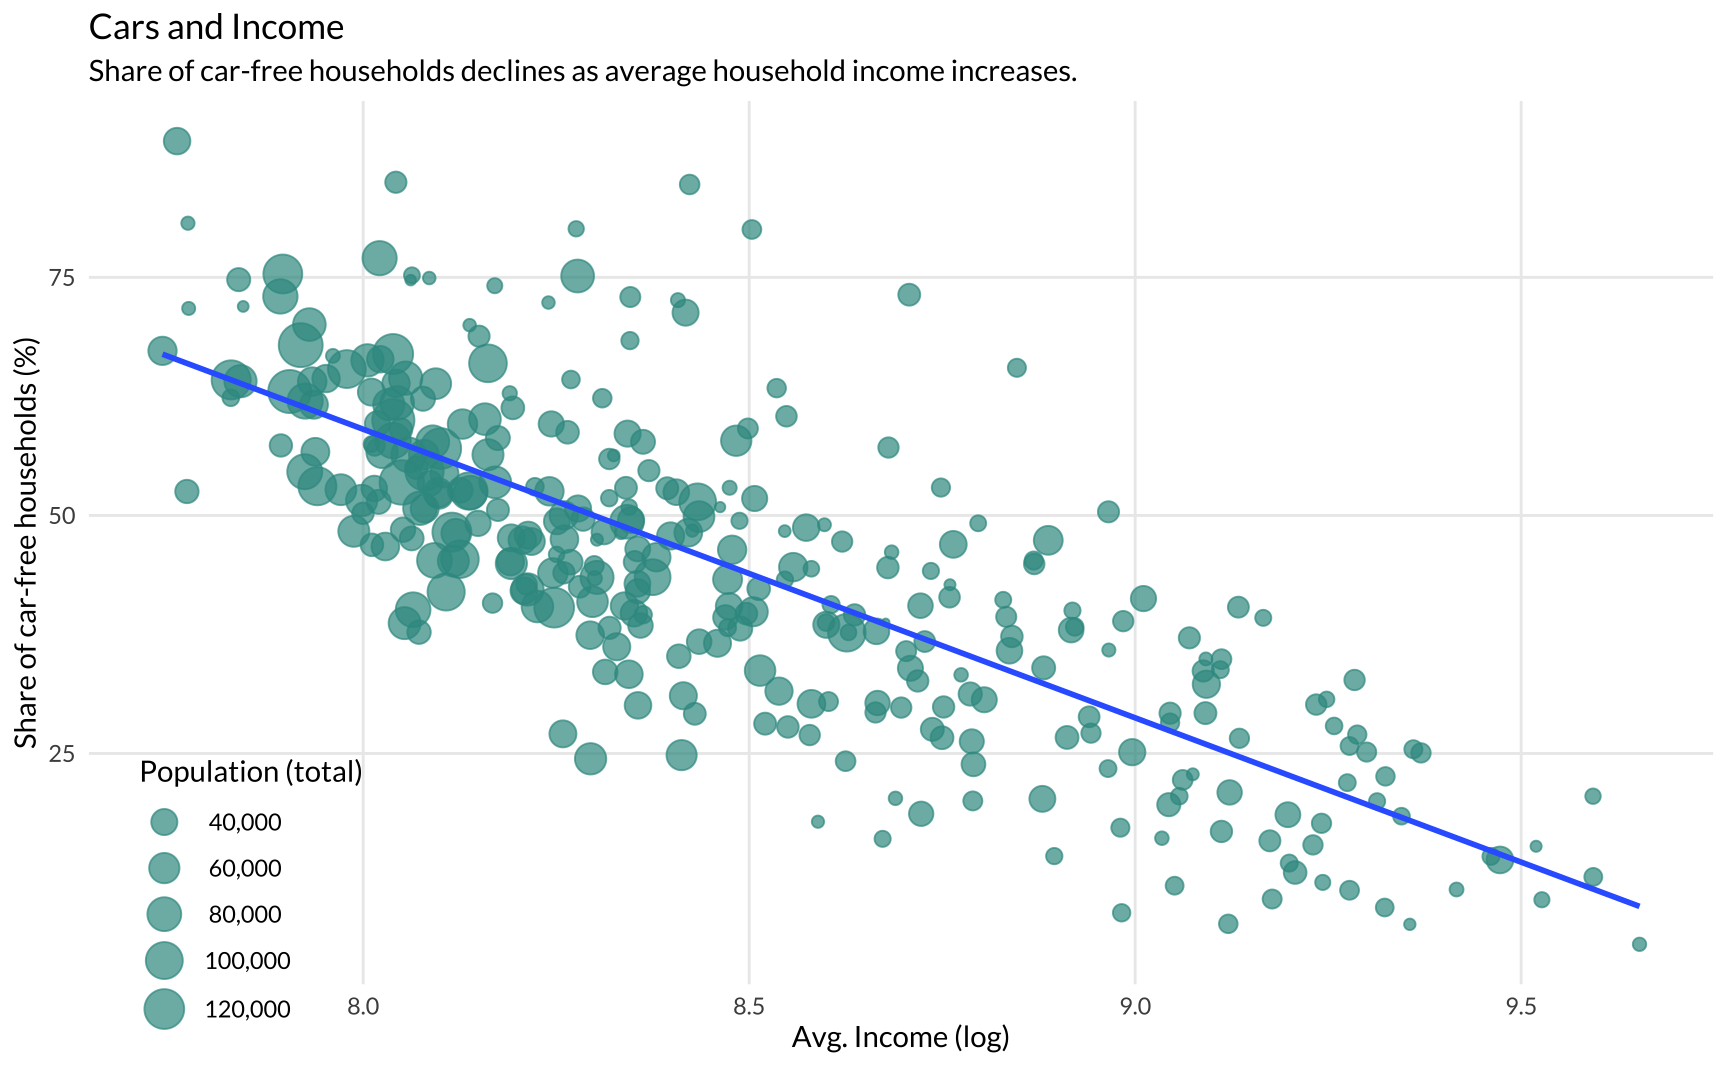
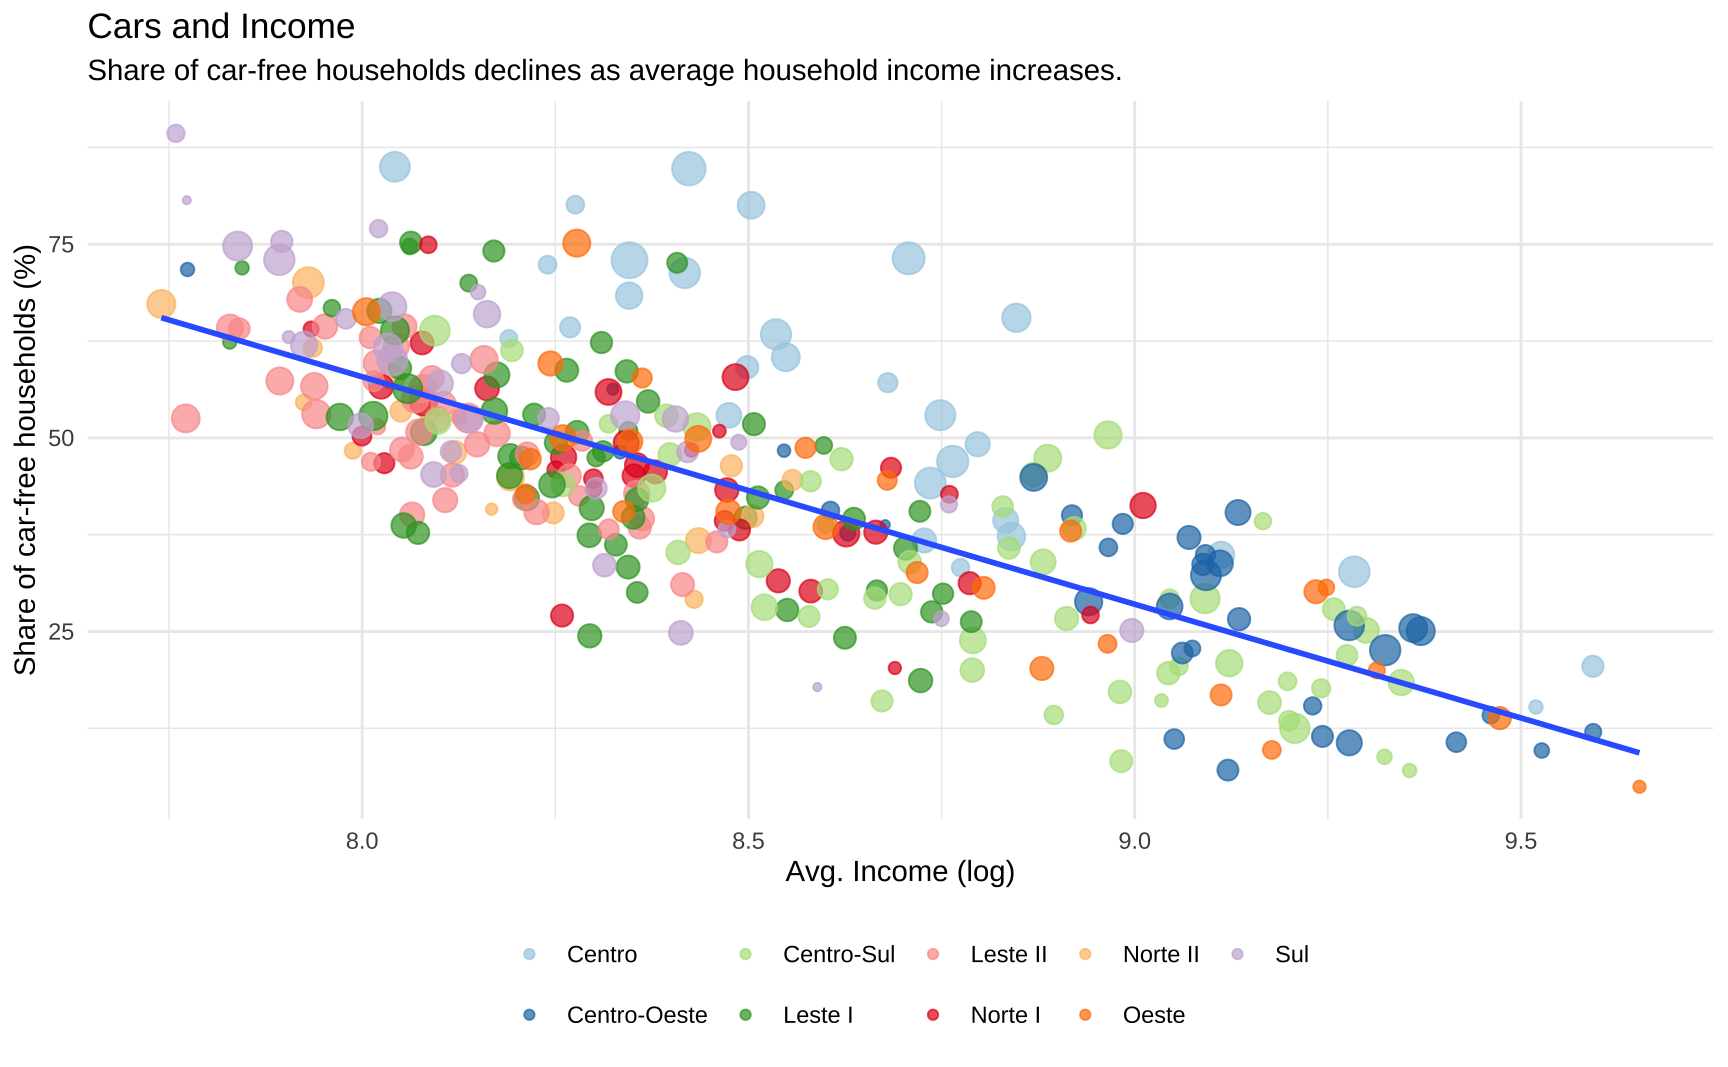
A distinct negative correlation exists between income and car-dependency in São Paulo. As income rises, households tend to demand more cars and the likelihood of finding car-free households decreases. The plot below shows average household income (in log-scale) against the percentage share of car-free households across all 329 zones. The size of each circle is scaled to represent the total population living in each zone. The richer, less populated zones, have the lowest shares of car-free households. Meanwhile, the more populated and poor households have some of the highest shares of car-free households3.
Footnotes
Excluding zero-income and zero-population OD zones.↩︎
Original quote: “Um ponto muito importante também é utilização, por exemplo, de combustíveis como o biometano e os combustíveis gasosos renováveis que são considerados verdes para a adaptação da frota”.↩︎
Given the considerable variation in OD zone sizes, one could argue that a more appropriate measure would be to utilize population density instead of total population. However, showcasing total population figures makes it easier to understand the overall impact on emissions.↩︎