library(ggplot2)
library(dplyr)
library(showtext)
library(patchwork)
font_add_google("Roboto Mono", "Roboto Mono")
font_add_google("Roboto Condensed", "Roboto Condensed")
showtext_opts(dpi = 300)
showtext_auto()
cities_age <- readr::read_rds(
here::here("static/data/census_aging_index_city.rds")
)
labels <- c("Less than 25", "25 to 50", "50 to 75", "75 to 100", "100 or more")
map2022 <-
ggplot(cities_age) +
geom_sf(aes(fill = age_index_2022, color = age_index_2022)) +
scale_fill_fermenter(
name = "",
breaks = seq(0, 125, 25),
palette = "Spectral"
) +
scale_color_fermenter(
name = "",
breaks = seq(0, 125, 25),
palette = "Spectral"
) +
coord_sf(xlim = c(NA, -34.469802)) +
labs(
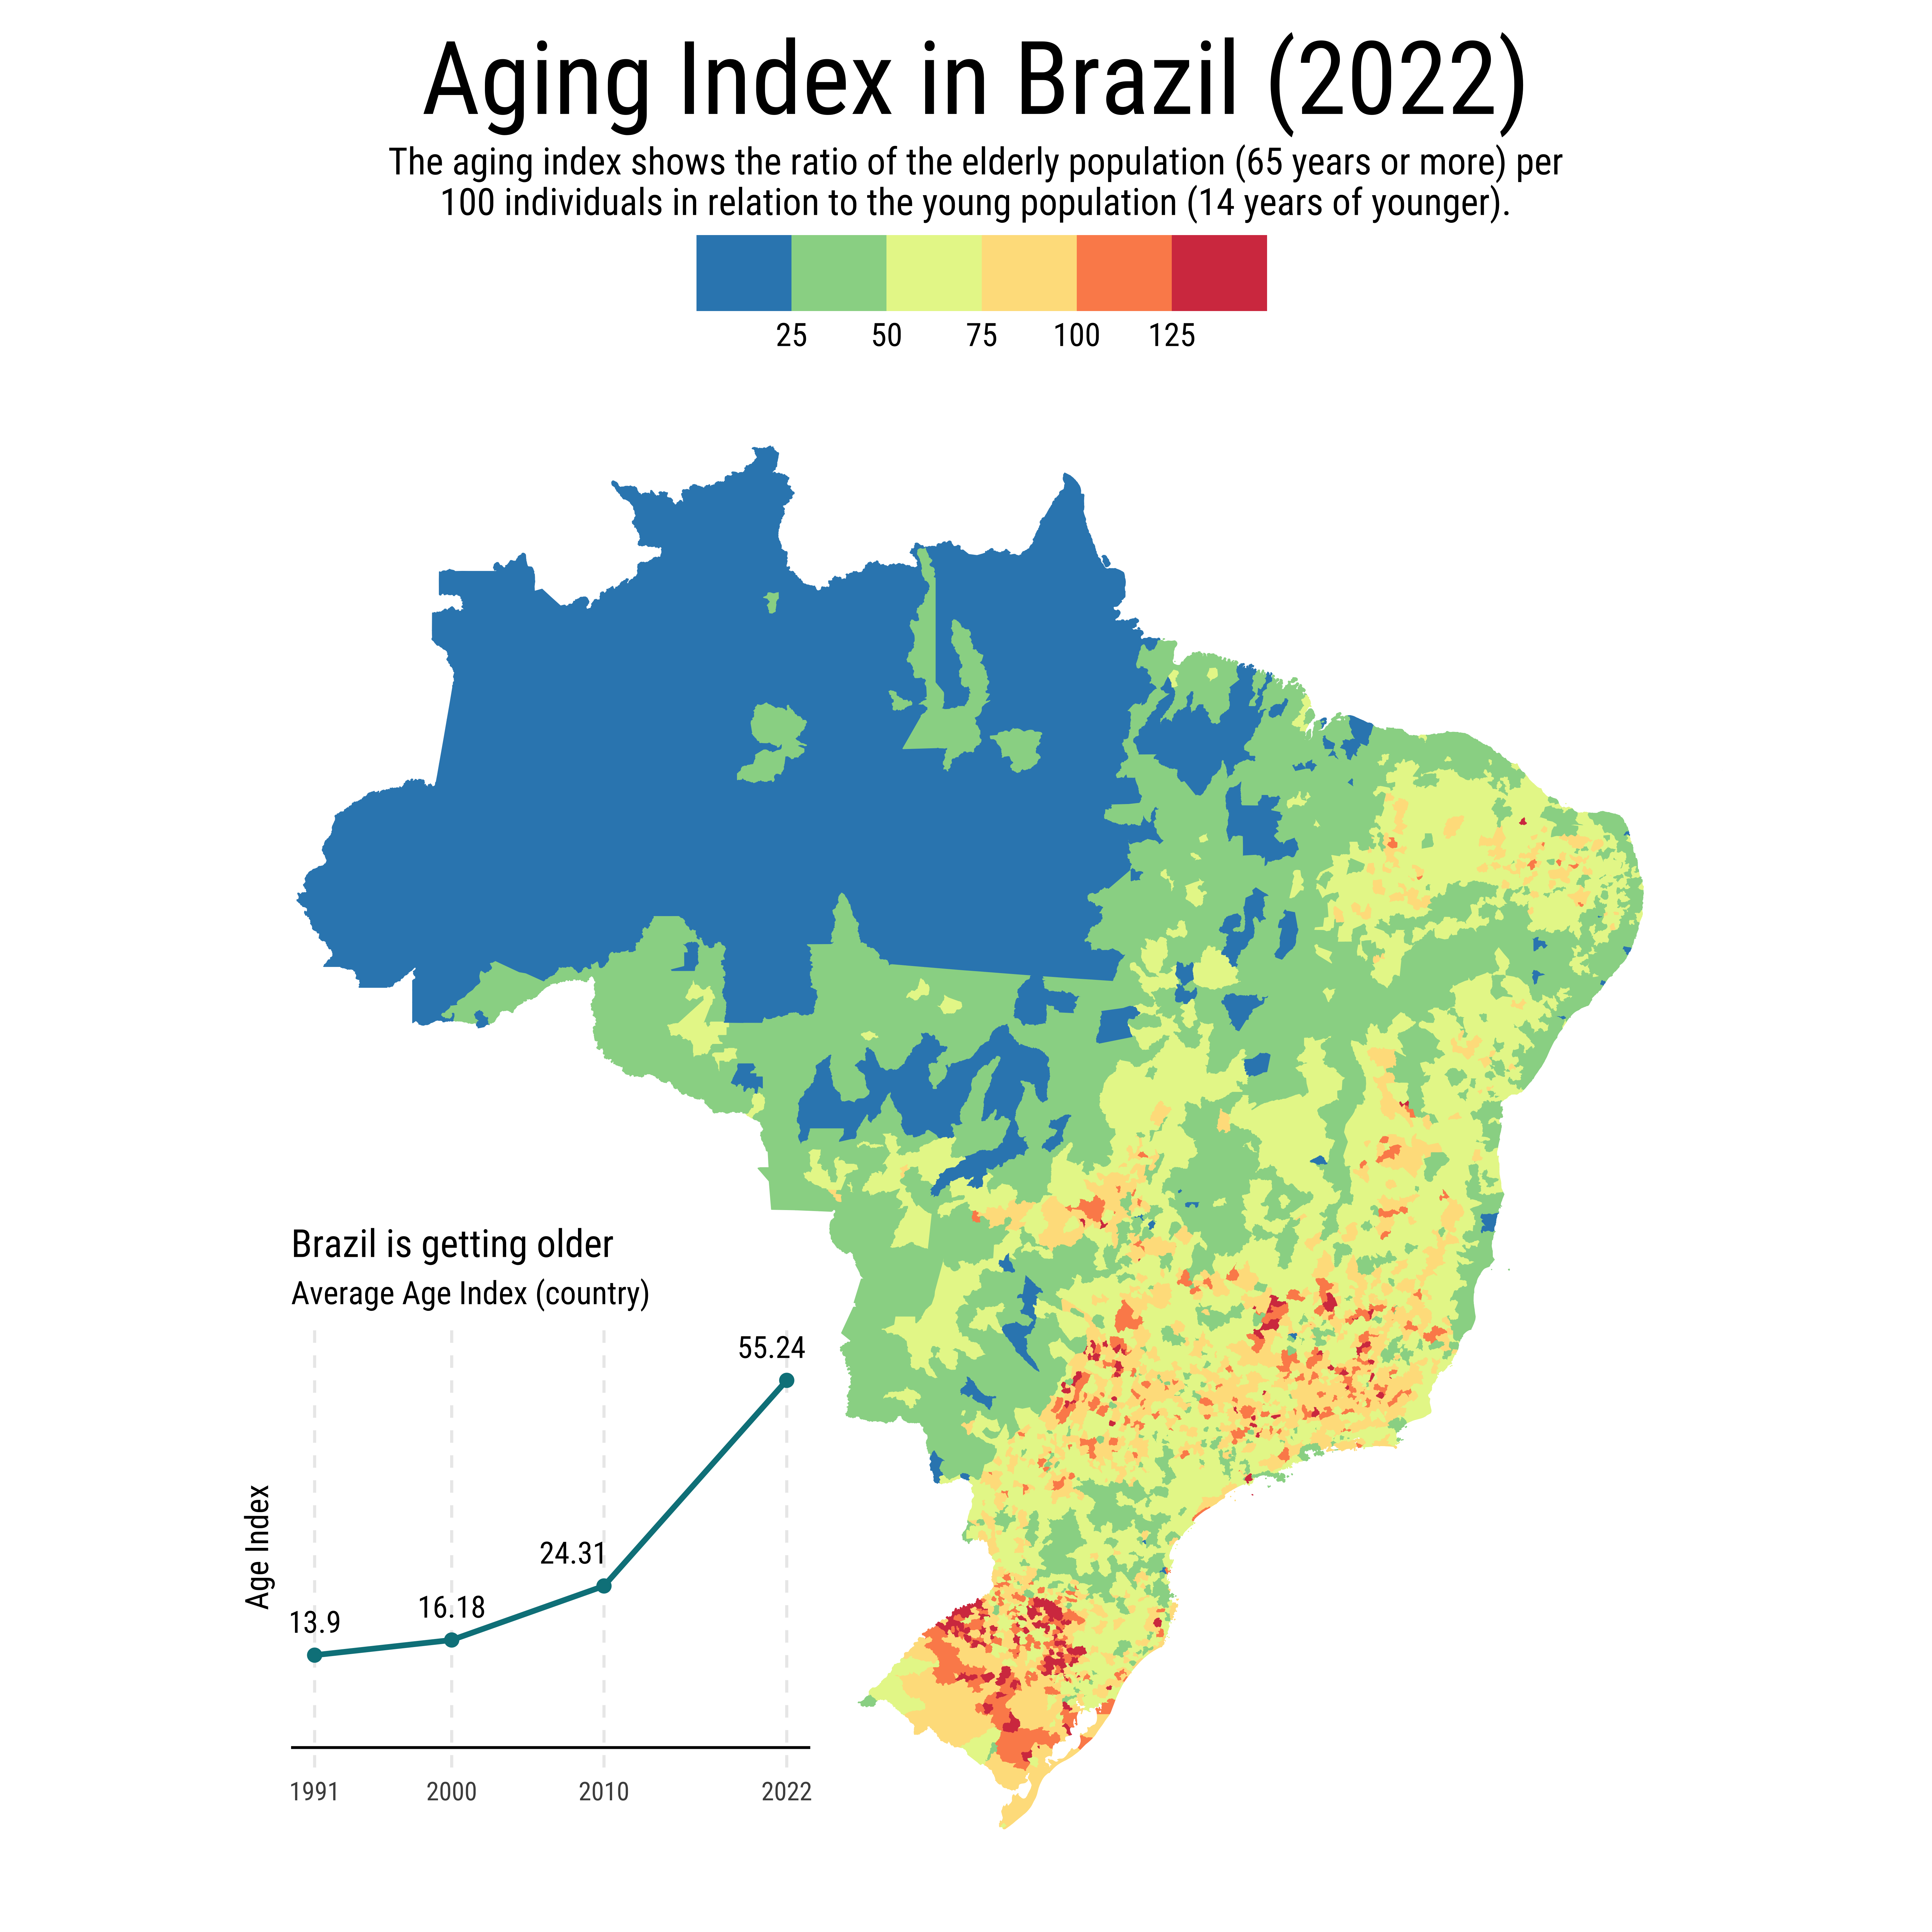
title = "Aging Index in Brazil (2022)",
subtitle = stringr::str_wrap(
"The aging index shows the ratio of the elderly population (65 years or more) per 100 individuals in relation to the young population (14 years of younger).",
80
)
) +
ggthemes::theme_map(base_family = "Roboto Condensed") +
theme(
#plot.title = element_text(hjust = 0.5, size = 22),
#plot.subtitle = element_text(hjust = 0.5, size = 14),
panel.background = element_rect(fill = "#ffffff", color = NA),
plot.background = element_rect(fill = "#ffffff", color = NA),
legend.position = "top",
legend.justification = 0.5,
legend.key.size = unit(1, "cm"),
legend.key.width = unit(1.5, "cm"),
legend.text = element_text(size = 12),
legend.margin = margin(),
plot.margin = margin(10, 5, 5, 10),
plot.title = element_text(size = 38, hjust = 0.5),
plot.subtitle = element_text(size = 14, hjust = 0.5)
)
tbl_age_index <- tibble(
year = c(1991, 2000, 2010, 2022),
age_index = c(13.90, 16.18, 24.31, 55.24)
)
sparkline <- ggplot(tbl_age_index, aes(year, age_index)) +
geom_hline(yintercept = 0) +
geom_point(color = "#02818a", size = 2) +
geom_line(color = "#02818a", lwd = 1) +
geom_text(
aes(label = age_index),
nudge_y = c(5, 5, 5, 5),
nudge_x = c(0, 0, -2, -1),
family = "Roboto Condensed",
size = 4
) +
scale_x_continuous(breaks = c(1991, 2000, 2010, 2022)) +
labs(
title = "Brazil is getting older",
subtitle = "Average Age Index (country)",
x = NULL,
y = "Age Index"
) +
theme_minimal(base_family = "Roboto Condensed", base_size = 12) +
theme(
panel.grid.minor = element_blank(),
panel.grid.major.y = element_blank(),
panel.grid.major.x = element_line(linetype = 2),
axis.text.y = element_blank()
)
final_map <- map2022 + inset_element(sparkline, 0, 0.05, 0.4, 0.45)