library(sf)
library(dplyr)
library(tidyr)
library(sidrar)
library(ggplot2)
library(ggtext)
library(showtext)
library(patchwork)
font_add_google("Fira Mono", "Fira Mono")
font_add_google("Open Sans", "Open Sans")
showtext_auto()
muni = geobr::read_municipality(year = 2020, showProgress = FALSE)
dim_muni = as_tibble(st_drop_geometry(muni))
analf = get_sidra(9543, geo = "City", classific = "c2")
tbl_gender = analf |>
janitor::clean_names() |>
as_tibble() |>
filter(sexo != "Total") |>
select(code_muni = municipio_codigo, sex = sexo, rate = valor) |>
mutate(code_muni = as.numeric(code_muni))
analf_gender = tbl_gender |>
mutate(sex = factor(sex)) |>
pivot_wider(id_cols = "code_muni", names_from = "sex", values_from = "rate") |>
rename_with(tolower) |>
mutate(gender_gap = homens - mulheres) |>
arrange(gender_gap)
analf_gender = analf_gender |>
left_join(dim_muni) |>
mutate(
is_nordeste = factor(if_else(code_region == 2, 1L, 0L))
)
tbl_analf = analf |>
janitor::clean_names() |>
as_tibble() |>
filter(sexo == "Total") |>
select(code_muni = municipio_codigo, rate = valor) |>
mutate(code_muni = as.numeric(code_muni))
analf_city = left_join(muni, tbl_analf, by = "code_muni")
analf_city = analf_city |>
mutate(analf_rate = 100 - rate)
breaks_jenks = BAMMtools::getJenksBreaks(analf_city$analf_rate, k = 9)[-1]
breaks_jenks = ceiling(breaks_jenks)
labels = c("<5%", "5-8%", "8-11%", "11-15%", "15-19%", "19-23%", "23-27%", "27-37%")
analf_city = analf_city |>
mutate(analf_group = factor(findInterval(analf_rate, breaks_jenks, left.open = TRUE)))
p1 = ggplot(analf_city) +
geom_sf(aes(fill = analf_group, color = analf_group), lwd = 0.15) +
scale_fill_brewer(
name = "",
type = "div",
direction = -1,
labels = labels
) +
scale_color_brewer(
name = "",
type = "div",
direction = -1,
labels = labels
) +
labs(
title = "Taxa de Analfabetismo",
subtitle = "Taxa de analfabetismo total por município"
) +
coord_sf(xlim = c(NA, -35)) +
ggthemes::theme_map(base_family = "Open Sans") +
theme(
legend.position.inside = c(0.1, 0.1),
plot.title = element_text(
hjust = 0.5,
size = 22,
margin = margin(5, 0, 5, 0)
),
plot.subtitle = element_text(
hjust = 0.5,
margin = margin(2.5, 0, 0, 0)
),
plot.margin = margin(0, 0, 0, 0)
)
analf_city = analf_city |>
mutate(is_nordeste = factor(if_else(code_region == 2, 1L, 0L)))
tbl_summary = analf_city |>
st_drop_geometry() |>
summarise(avg = mean(analf_rate), .by = "is_nordeste")
p2 = ggplot() +
geom_density(
data = analf_city,
aes(x = analf_rate, fill = is_nordeste),
alpha = 0.6
) +
geom_vline(
data = tbl_summary,
aes(xintercept = avg, color = is_nordeste),
lty = 2
) +
geom_hline(yintercept = 0) +
guides(fill = "none", color = "none") +
scale_fill_manual(values = c("#01665e", "#8c510a")) +
scale_color_manual(values = c("#01665e", "#8c510a")) +
labs(
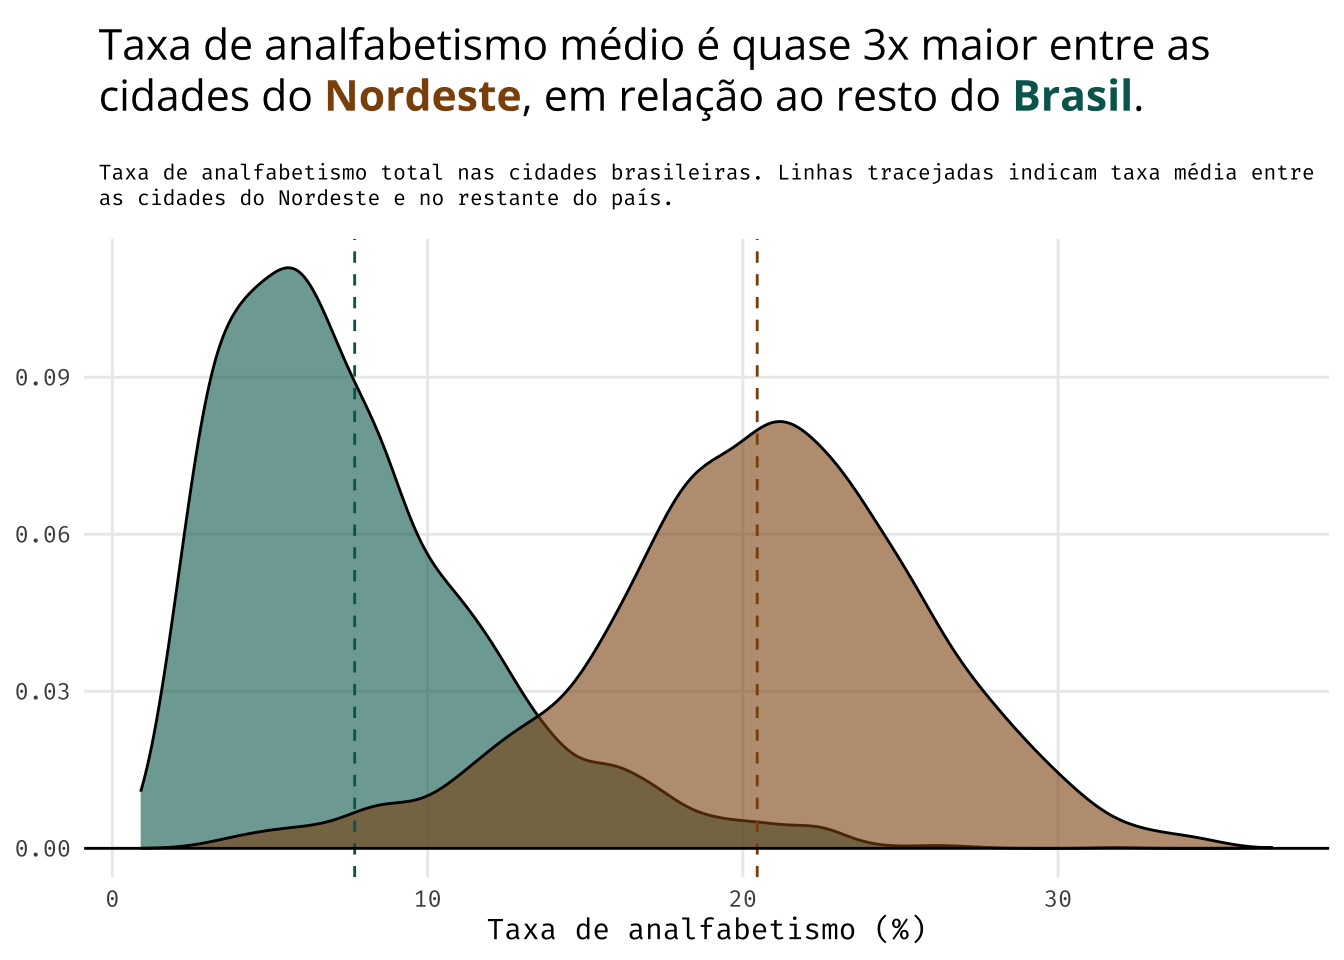
title = "Taxa de analfabetismo médio é quase 3x maior entre as cidades do <b><span style='color:#8c510a'>Nordeste</span></b>, em relação ao resto do <b><span style='color:#01665e'>Brasil</span></b>.",
subtitle = "Taxa de analfabetismo total nas cidades brasileiras. Linhas tracejadas indicam taxa média entre as cidades do Nordeste e no restante do país.",
x = "Taxa de analfabetismo (%)",
y = NULL
) +
theme_minimal(base_family = "Fira Mono") +
theme(
panel.grid.minor = element_blank(),
plot.title = element_textbox_simple(
size = 16,
padding = margin(5.5, 5.5, 5.5, 5.5),
margin = margin(0, 0, 5.5, 0),
family = "Open Sans"
),
plot.subtitle = element_textbox_simple(
size = 8,
padding = margin(5.5, 5.5, 5.5, 5.5),
margin = margin(0, 0, 5.5, 0))
)
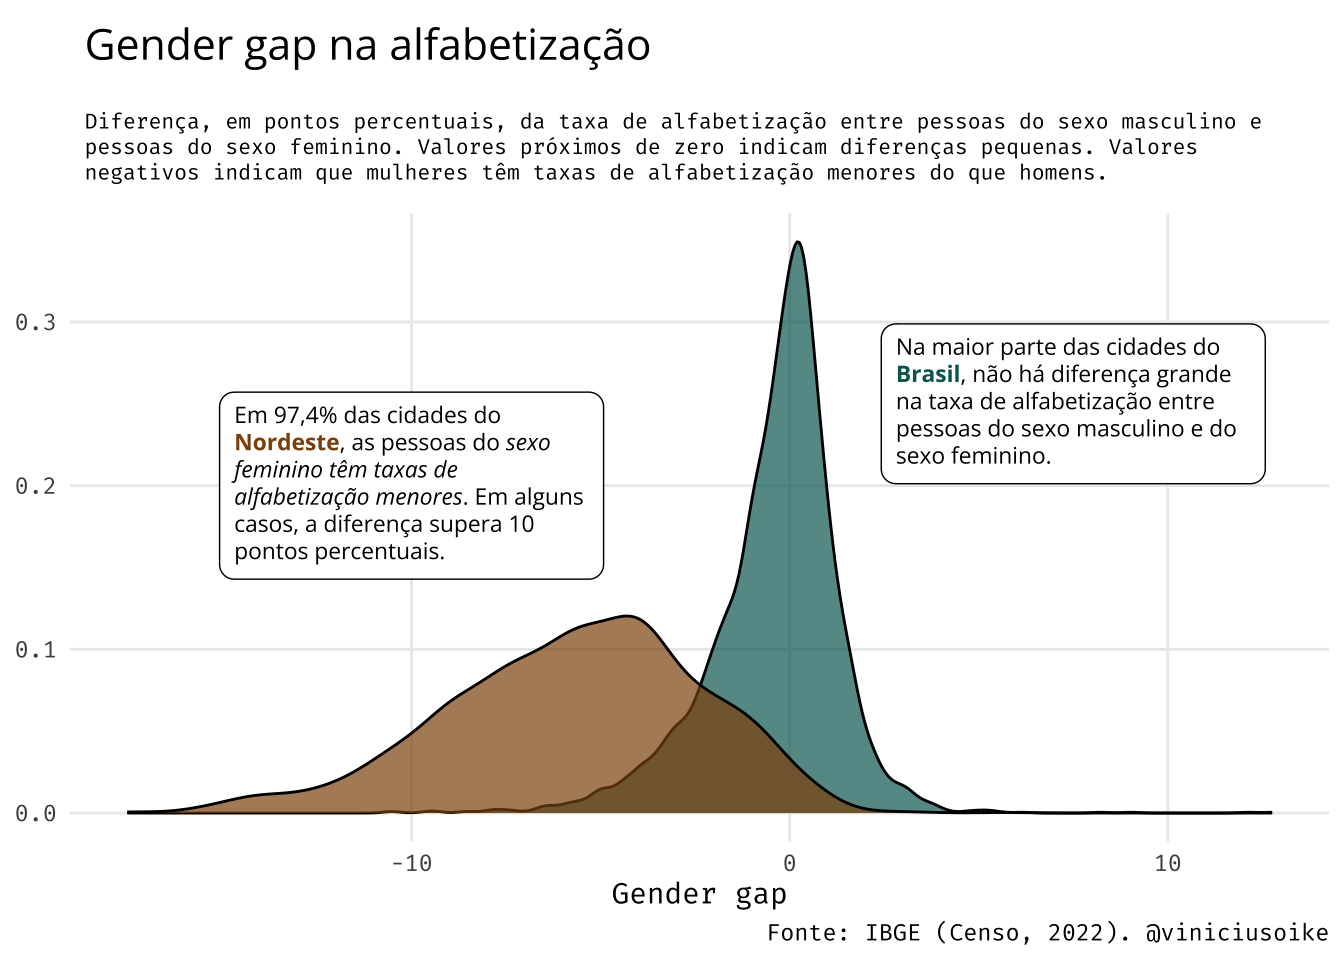
label_1 = "Em 97,4% das cidades do <b><span style='color:#8c510a'>Nordeste</span></b>, as pessoas do <i>sexo feminino têm taxas de alfabetização menores</i>. Em alguns casos, a diferença supera 10 pontos percentuais."
label_2 = "Na maior parte das cidades do <b><span style='color:#01665e'>Brasil</span></b>, não há diferença grande na taxa de alfabetização entre pessoas do sexo masculino e do sexo feminino."
text_labels = tibble(
x = c(-10, 7.5), y = c(0.2, 0.25), label = c(label_1, label_2)
)
p3 = ggplot() +
geom_density(
data = analf_gender,
aes(x = gender_gap, fill = is_nordeste),
alpha = 0.7) +
geom_textbox(
data = text_labels,
aes(x, y, label = label),
family = "Open Sans",
size = 3
) +
scale_fill_manual(values = c("#01665e", "#8c510a")) +
guides(fill = "none") +
labs(
title = "Gender gap na alfabetização",
subtitle = "Diferença, em pontos percentuais, da taxa de alfabetização entre pessoas do sexo masculino e pessoas do sexo feminino. Valores próximos de zero indicam diferenças pequenas. Valores negativos indicam que mulheres têm taxas de alfabetização menores do que homens.",
caption = "Fonte: IBGE (Censo, 2022). @viniciusoike",
y = NULL,
x = "Gender gap"
) +
theme_minimal(base_family = "Fira Mono") +
theme(
panel.grid.minor = element_blank(),
plot.title = element_textbox_simple(
size = 16,
padding = margin(5.5, 5.5, 5.5, 5.5),
margin = margin(0, 0, 5.5, 0),
family = "Open Sans"
),
plot.subtitle = element_textbox_simple(
size = 8,
padding = margin(5.5, 5.5, 5.5, 5.5),
margin = margin(0, 0, 5.5, 0))
)
panel = p1 | (p2 / p3)
panel = panel + plot_layout(widths = c(0.5, 0.5))